-
Clinician In a Loop (2017-2018)
Iterative Design of Visual Analytics for a Clinician-in-the-loop Smart Home: we design CIL, a clinician-in-the loop visual interface, that provides clinicians with patient behavior patterns to support remote health monitoring and assessment.
* funded by National Institues of Health (NIH)
* collaborated with clinicians, psychologist and nurses
My contribution was to calculate the below features to represent human behaviors based on smart home sensor data.
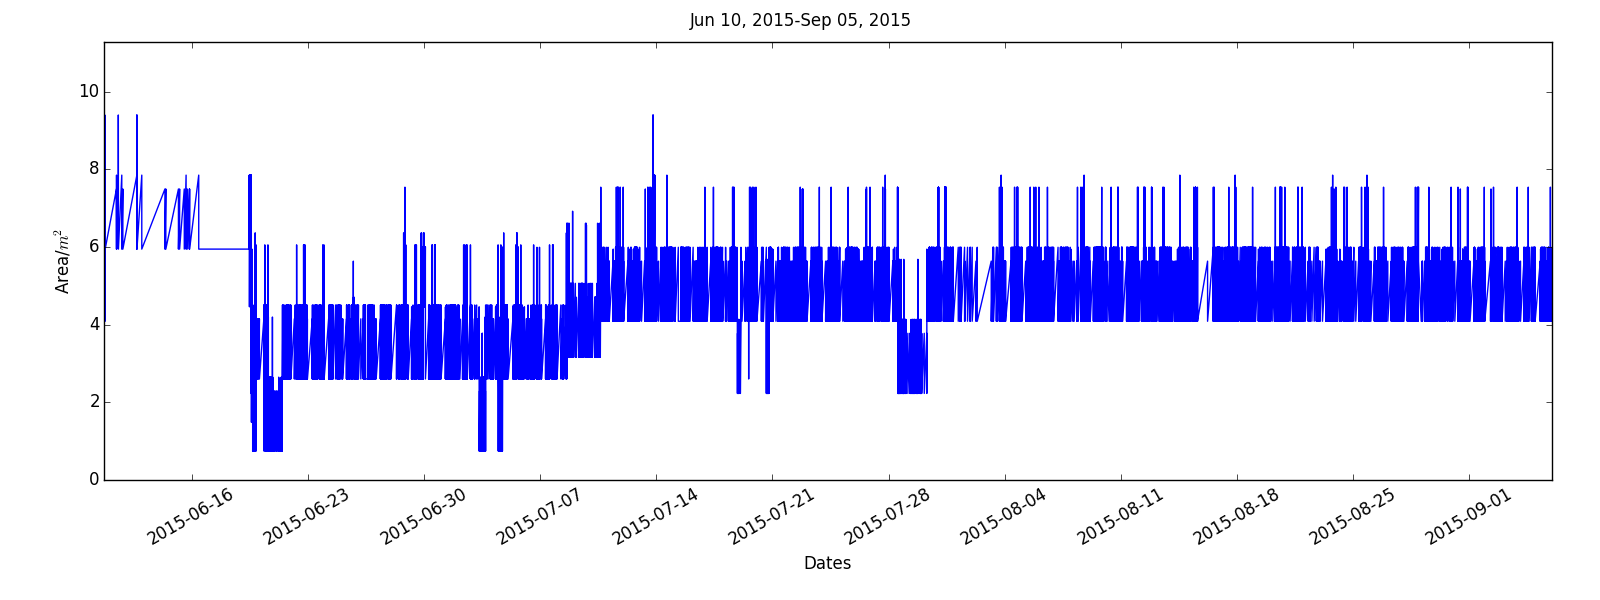
1. distribution of time spent in different area of the home.
2. daily sleep duration (daytime/nighttime/overall)
3. ovrall activity level in home
4. number of sleep interruptions
5. nighttime relative walking speed
6. baseline for comparisions between healthy situations and ailments showing up.
7. time-aligned location & activity distribution.
Visualization Demo
Population Modelling (2016-Present)
Our study identifies and models the patterns of human daily routines in 99 smart homes with diverse participants, and provides insights on behavior patterns and detection of deviations that indicate potential health problem. Not only can this lead to more effective medical interventions, but these findings may benefit other fields.
* funded by National Science Foundation (NSF)
Part 1:
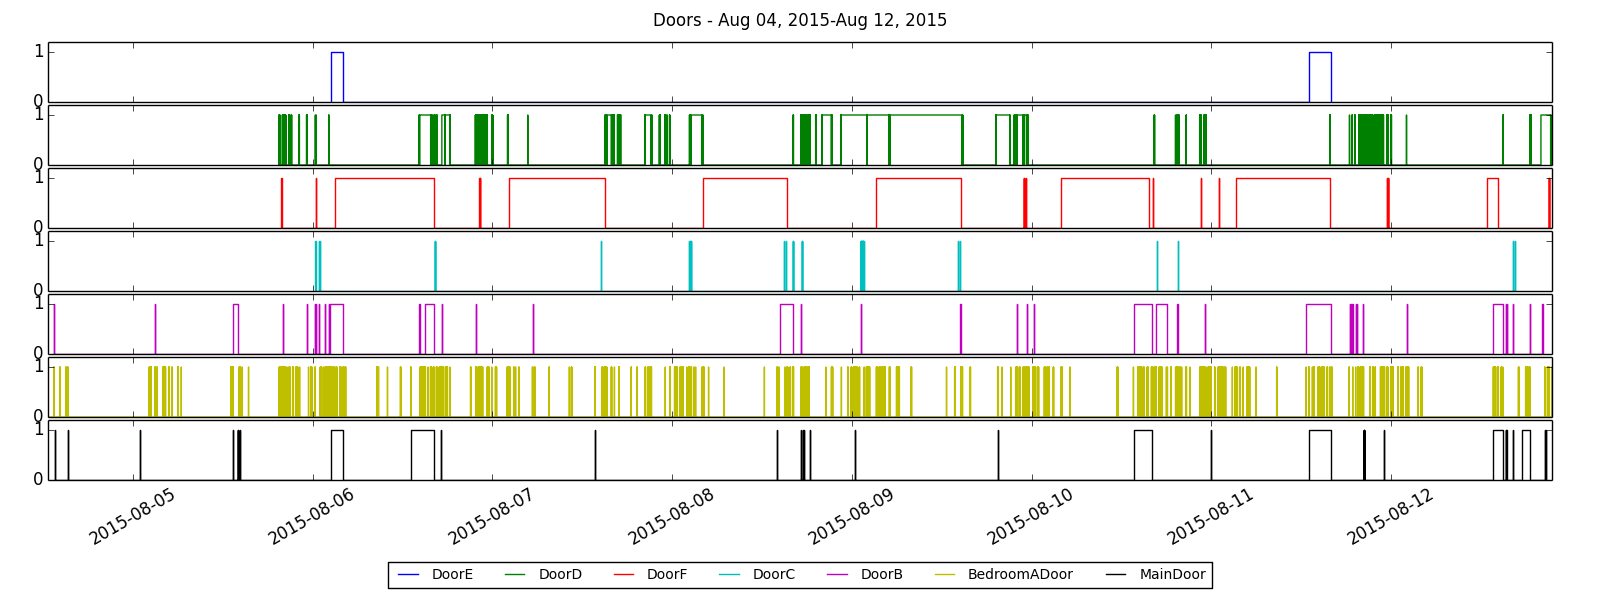
Data Collection and Processing (click a graph to zoom in)..
Part 2:
outlier detection and model fitting (click a graph to zoom in).
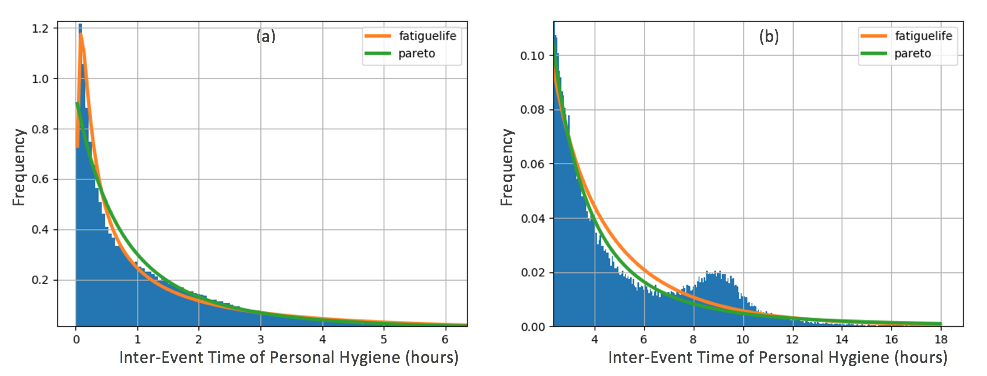
Part 2.1: Modeling Fitting for the Personal Hygiene inter-event time based on all the smart home data.
-
Part 2.2: outlier detection and model fitting for seven routine activities).
( seven activities of daily routine: Work, Sleep, Relax, Cook, Eat, Personal Hygiene, and Wash Dishes. )


