To illustrate the type of output that is possible from this scheme, we
will apply it to results obtained from an FDTD solution to a simple
scattering problem. In this example, a planar TE pulse (the non-zero
fields are  ,
,  , and
, and  ) illuminates a rectangular perfect
electric conductor (PEC). The pulse is a Ricker wavelet and is
discretized so that there are 48 points per wavelength at the peak of
its spectral energy. The ``peak'' frequency, or the frequency with
peak spectral energy, has a corresponding wavelength
) illuminates a rectangular perfect
electric conductor (PEC). The pulse is a Ricker wavelet and is
discretized so that there are 48 points per wavelength at the peak of
its spectral energy. The ``peak'' frequency, or the frequency with
peak spectral energy, has a corresponding wavelength  . As
shown in Fig. 4, the rectangular scatterer is
. As
shown in Fig. 4, the rectangular scatterer is  and has five slots cut in it which are separated
(center-to-center) by
and has five slots cut in it which are separated
(center-to-center) by  .
.
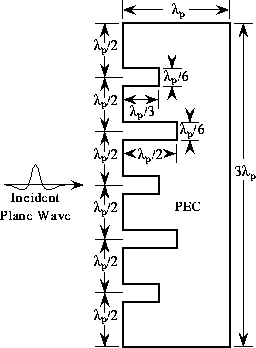
Figure 4: Sketch of scatterer in terms of free-space wavelengths at
the peak frequency of the illuminating pulse. For the subsequent
results, the slots have been loaded with a dielectric with a relative
permittivity of 9.0. Thus, the electrical dimensions of the slots
are effectively multiple by a factor of 3.0.
Each slot is  high and has a length of either
 or
or  .
.
To demonstrate the utility of animations, one merely has to view
simulations of this scattering problem both with and without
dielectric loading of the slots. Such animations can clearly show the
effect that slot resonances, or the lack thereof, have on the way in
which the fields are scattered. Since animations cannot be presented
here and the display of a long sequence of still shots would be
wasteful, results will be presented only for the case where the slots
are loaded with a dielectric that has a relative permittivity of 9.0.
For this loading, the slots have an electrical height of  and a width of either
  or
or  , and hence have a
strong resonance. Images will only be shown at a single point in
time. Complete MPEG animations corresponding to these images are
available from the Web site.
, and hence have a
strong resonance. Images will only be shown at a single point in
time. Complete MPEG animations corresponding to these images are
available from the Web site.
Figures 5-8 show the total  field
at a point in time slightly after the incident pulse has past the
scatterer. The incident pulse, which travels from left to right
across the image plane, has a maximum value of unity whereas the total
field, measured over the duration of the animation, has a maximum
value of approximately 2.88 (A/m). This maximum value occurred at a
point earlier in the animations than the time at which these images
were recorded. However, to be consistent throughout the entire set of
images and to illustrate the usefulness of the log scaling, a
normalization of 2.88 (i.e.,
field
at a point in time slightly after the incident pulse has past the
scatterer. The incident pulse, which travels from left to right
across the image plane, has a maximum value of unity whereas the total
field, measured over the duration of the animation, has a maximum
value of approximately 2.88 (A/m). This maximum value occurred at a
point earlier in the animations than the time at which these images
were recorded. However, to be consistent throughout the entire set of
images and to illustrate the usefulness of the log scaling, a
normalization of 2.88 (i.e.,  ) was used for
each of these images. Figures 5-7 each used
three decades of logarithmic scaling (
) was used for
each of these images. Figures 5-7 each used
three decades of logarithmic scaling ( ) whereas
Fig. 8 used a linear scale. Figure 5
is the gray scale image of the absolute value of the field. Figure
6 is the one-sided color image of the absolute value of
the field and Fig. 7 shows the two-sided color image. In
Fig. 8 the one-sided mapping is also used. For
each of these images a narrow color map is shown along the left side
of the image. Note that by using a linear scale, the image in
Fig. 8 appears quite faint even along the maximum
value of the incident pulse. This is a consequence of the fact that
the image has been normalized by 2.88 whereas the incident pulse has a
maximum value of unity. Thus, the values in the incident pulse only
span one-third of the range of colors in the incident pulse. In the
images that incorporate log scaling, field values between
) whereas
Fig. 8 used a linear scale. Figure 5
is the gray scale image of the absolute value of the field. Figure
6 is the one-sided color image of the absolute value of
the field and Fig. 7 shows the two-sided color image. In
Fig. 8 the one-sided mapping is also used. For
each of these images a narrow color map is shown along the left side
of the image. Note that by using a linear scale, the image in
Fig. 8 appears quite faint even along the maximum
value of the incident pulse. This is a consequence of the fact that
the image has been normalized by 2.88 whereas the incident pulse has a
maximum value of unity. Thus, the values in the incident pulse only
span one-third of the range of colors in the incident pulse. In the
images that incorporate log scaling, field values between  and
and  span the first third of the color
map, values between
span the first third of the color
map, values between  and
and  span
the next third, and value between
span
the next third, and value between  and 2.88 span
the final third.
and 2.88 span
the final third.
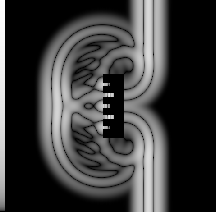
Figure 5: Gray scale plot the absolute value of the field using three
decades of scaling.
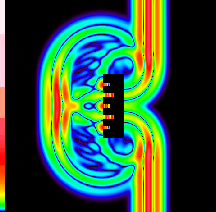
Figure 6: One-sided color image of the absolute value of the field using
three decades of scaling.

Figure 7: Two-sided color image of the field using three decades of
scaling.
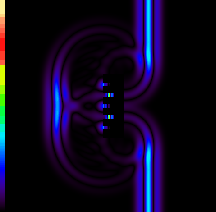
Figure 8: One-sided color image of the absolute value of the field
using a linear scale.