Animations permit data to be viewed from a unique perspective and can serve as an important analysis tool in many research projects. In a scheme where field values within a computational domain are mapped to color-coded pixels, one can readily observe the evolution of the field by animating the images obtained from the mapping. An animation might be used to show the propagation of a field as a function of time, or it might be used to show the changes in the distribution of a field as a function of some problem parameter (in a scattering problem this parameter might be the permittivity of the scatterer or a characteristic dimension). In many instances, animations can provide insights into the governing physical mechanisms; such insights may not be yielded from ``static'' results (e.g., results such as radiation patterns, resonant frequencies, or scattering cross sections). Unfortunately, the development of ``in-house'' animation capabilities has historically been beyond the reach of smaller research operations. However, the continued decline in the cost of computing and the easy access the Internet has provided to powerful and robust public-domain software allows animations to be easily produced by small laboratories with modest computational resources.
In this paper we present a scheme to obtain animations of an ``evolving'' field. For the sake of concreteness, the scheme will be presented in the context of the Finite-Difference Time-Domain (FDTD) technique applied to electromagnetic wave propagation. However, the same scheme can be used for many other applications---the underlying premise is that the values in a two-dimensional grid are changing as a function of some parameter and the goal is to observe those changes directly as a function of the parameter. For example, the scheme presented here might be used to make an animation that shows how the absorption of energy within a material changes as the conductivity is varied (and the calculation of the absorption might be done using any one of a number of techniques besides FDTD). Although the displayed values are taken from a two-dimensional grid, this grid can be a slice through a data space of three or more dimensions; hence, the scheme can be meaningfully applied to problems of arbitrary dimension.
To use the scheme presented here, the modifications that must be made to existing code are likely to be minimal since most of the work is done in ``post-processing.'' Our implementation of the scheme relies upon publicly-available software and, in that sense, is free. However, in the sense that the scheme requires the modification of existing code, downloading software from different sites, and sorting through some programming details (all relatively simple), the scheme may be thought of as ``low cost.'' Due to the widespread use of Fortran in the electromagnetics community, code will be presented in Fortran, but translation to C is straightforward. In fact, since C provides a more natural environment for byte-wise operations, the C code is somewhat simpler and significantly faster than the Fortran version. To obtain the C routines, the interested reader is directed to the on-line site mentioned below.
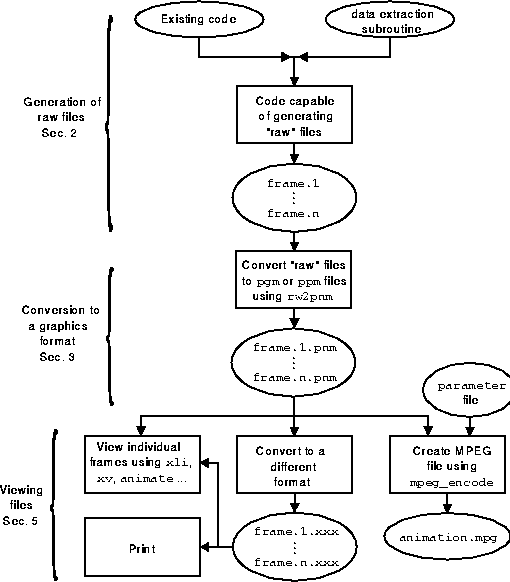
Figure 1: Flow chart describing the creation of animations or still
images. Ovals are used to indicate stored data files or program
listings; rectangles indicate executable routines.
The approach described in this paper, which is depicted in Fig. 1, is one of many ways to construct animations of two-dimensional field data. Many commercial and public-domain software suites (examples include MATLAB, IDL, PV-WAVE, AVS, Mathematica, VTK, Explorer, Khoros) contain the basic procedures needed to build individual animation frames. The elements of the approach described here are:
Depending on the desired audience for animations produced using these techniques, some video production steps might be needed (e.g., titling, recording onto video tape, editing into productions complete with soundtracks, multiple animation segments, dissolves and fades, etc.). These production steps are beyond the scope of this article; specialized publications, such as Digital Media, contain articles and advertisements for companies which offer solutions and services for computer-generated video productions.
Because the scheme presented here is so simple, it may lack features that some could consider essential for certain applications. Those interested in obtaining more powerful software are directed to the software listed in Appendix C. Nevertheless, the scheme presented here does have the attraction that, due to its simplicity, it is easy to tailor to different purposes or incorporate directly into existing code. Also, it is relatively fast and efficient and can be used to generate animations ``on the fly.''
The paper is organized as follows: Section 2 describes the the assumed format for the ``raw'' frame (or data) files. The necessary modification of existing code to generate the raw data is discussed. Section 3 describes the conversion of the raw frame files into an acceptable graphics file format. Section 4 presents some examples of typical output. The final section discusses ways in which the frames may be viewed (either individually or as an animated sequence). The appendices provide code listings and Internet sites where relevant software can be obtained.
To save the interested reader from typing code, complete code is available on-line via the URL
http://www.eecs.wsu.edu/~schneidj/Animations/This Web page provides example output as both still shots and MPEG animations. Additionally, the FDTD code that generated the examples is presented. This URL also provides links to all the relevant Internet sites mentioned in this paper.